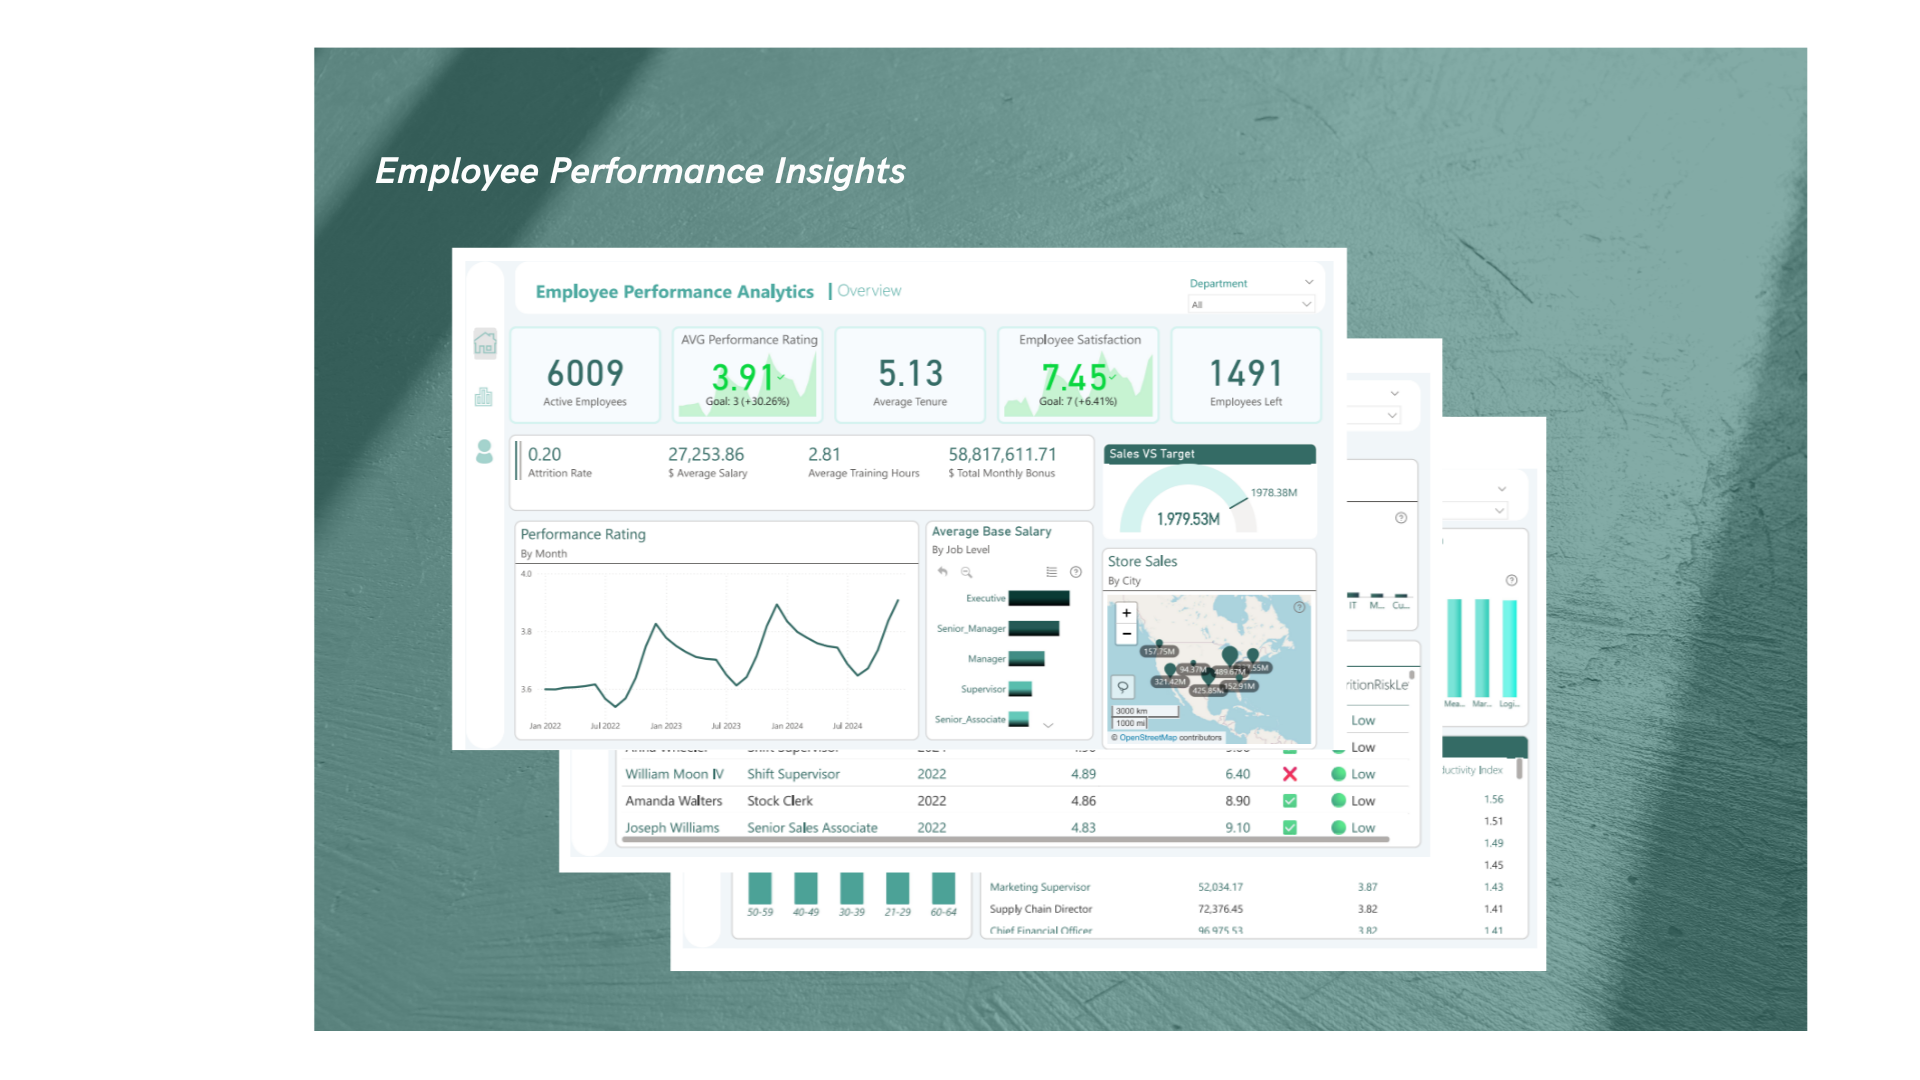
Analyzed and visualized employee data to uncover top-performing managers 🏆, department trends 💼, promotion patterns 📈, and attrition hotspots 🚪.
Turned raw HR data into clear, actionable insights that help boost retention, fairness, and overall workforce performance 📊✨.
Explored layoffs data using SQL to reveal trends across industries, companies,
and time periods. Identified key patterns and insights
that highlight the scale and impact of global layoffs. 💼📊
Cleaned and prepared the layoffs dataset by removing
duplicates, fixing inconsistencies, and handling missing values to ensure a smooth and accurate analysis process. 🧼📂
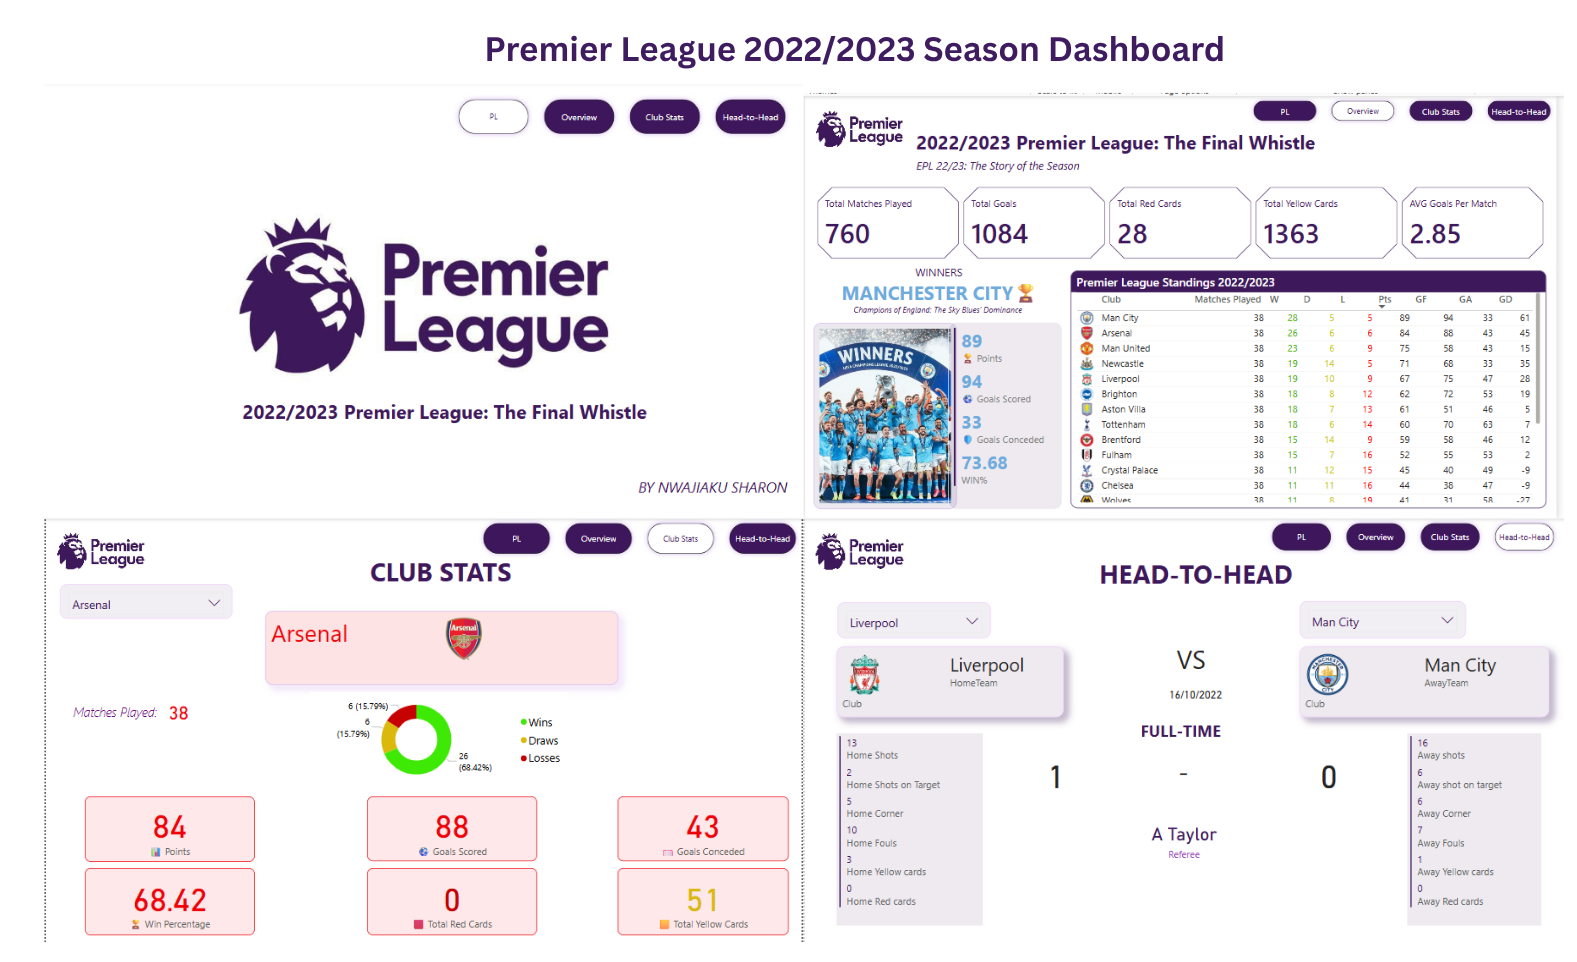
A sleek and interactive Power BI report breaking down the season — from top scorers and club stats to head-to-head matchups. 📊
Clean visuals, quick insights, and a final whistle wrap-up! 🏆

Gain clear visibility into sales performance with this intuitive Power BI dashboard.
Easily identify top performers 🏆, analyze product trends 📊,
and evaluate regional contributions through streamlined visualizations designed for efficient decision-making

An interactive Power BI dashboard that visualizes key HR metrics like headcount 👥, salary distribution 💰, and departmental trends 🏢.
Designed to support quick decision-making and reveal workforce patterns across branches and roles. Built for clarity, impact, and action! ⚡
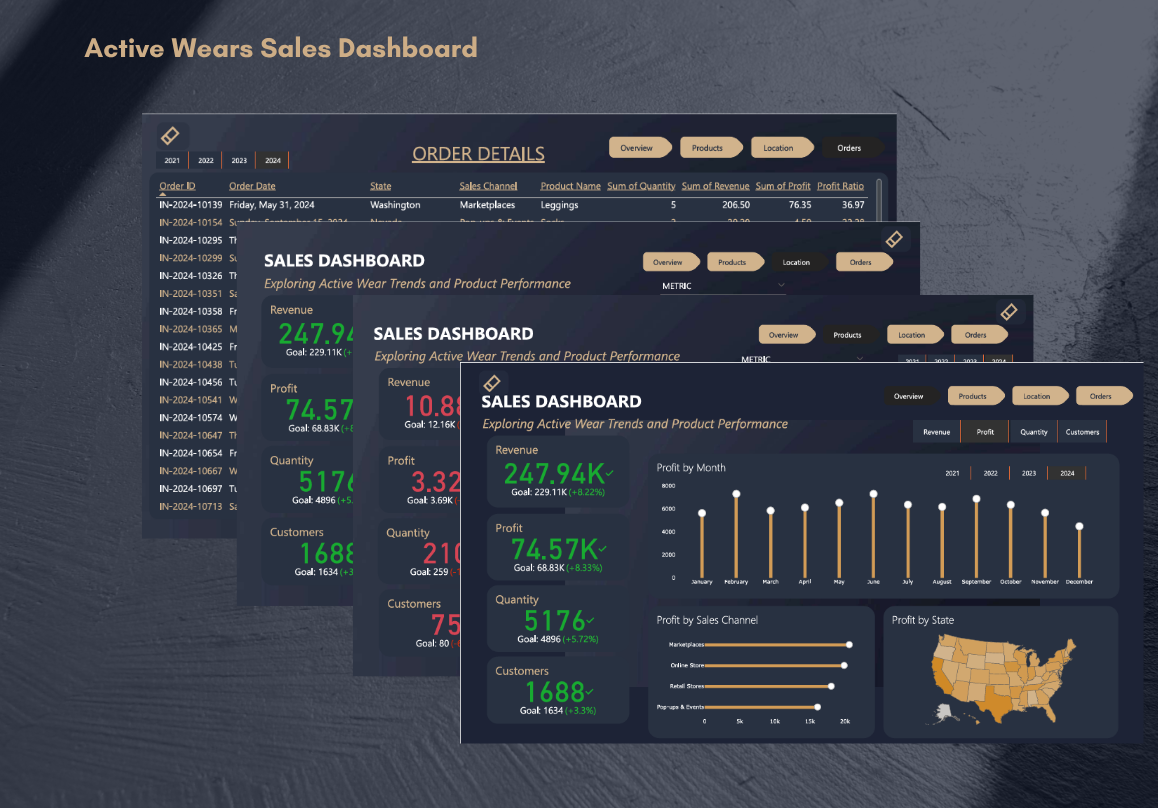
Explored activewear sales data to identify top-selling products, customer preferences, and seasonal trends.
Built an interactive dashboard to visualize key metrics and support data-driven decisions for boosting sales and inventory management 🏃♀️📈.

Unlock key financial insights with this interactive dashboard! Track performance trends, segment breakdowns, and 🌍regional
profitability—all in one dynamic visual report. Perfect for fast, data-driven decisions. 📊
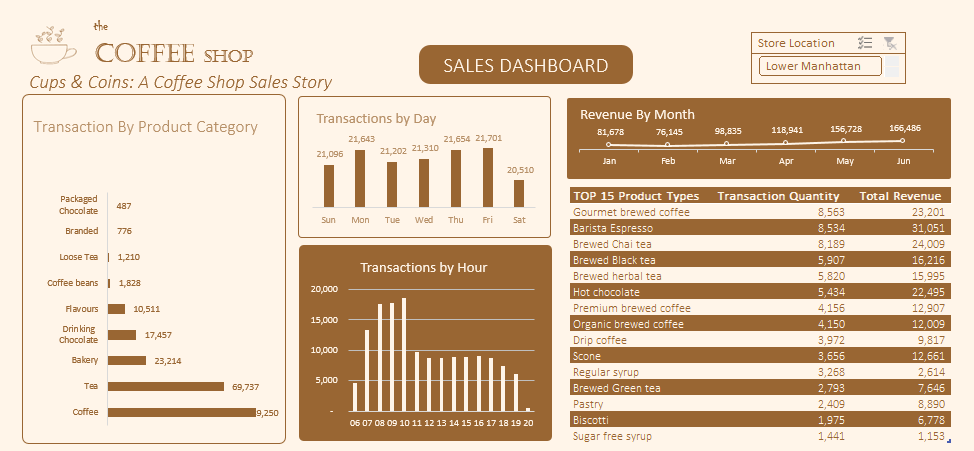
Analyzed coffee shop sales data to uncover top products, busiest days, peak hours, and revenue trends.
Created an interactive Excel dashboard using pivot tables and slicers to deliver clear,
actionable insights that tell the story behind the numbers ☕️📊.
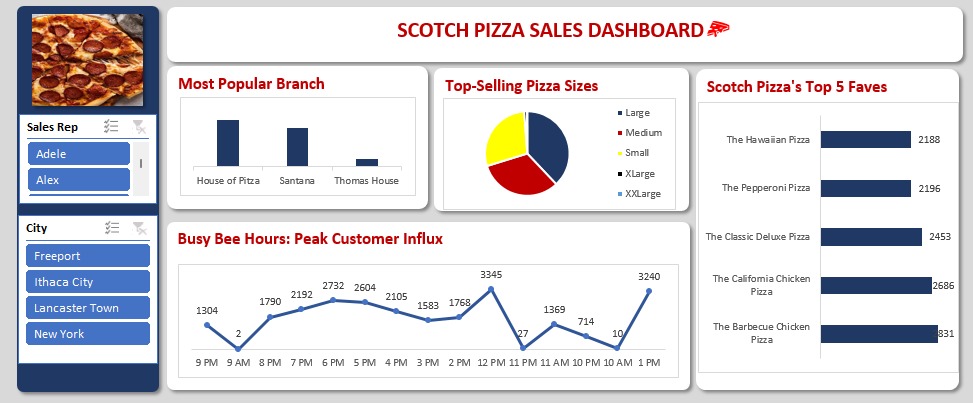
Analyzed and visualized Scotch Pizza sales data to reveal top branches 🍕,
favorite pizzas ❤️, peak business hours ⏰, and preferred sizes 📏.
Transformed messy data into clear insights that help drive smarter decisions 📊✨.